
A forecast that says “NO” every time is right on 99 of 100 binary outcomes if only one event happens. With probabilities of exactly zero, its Brier score is 0.0100. That looks small on a scale that runs to one. It tells you very little until you know how often the event occurs and what a forecast without case-specific information would have scored. The revealing comparison is with a forecast that gives every case a 1% chance.
Keep the event set fixed and change the forecast
Take 100 invented contracts. Exactly one settles YES and the other 99 settle NO. Think of these as a worksheet with an answer key. There is no exchange, trading history, or estimate of the real share of rare events in the sample. In every row of the table we score the same 100 outcomes. We supply the 1% reference in advance for this example. In a real evaluation the reference would have to be available before those outcomes were known.
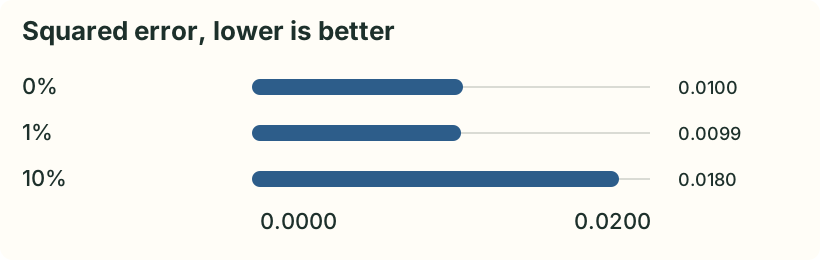
For a YES probability p and outcome y, where y is one for YES and zero for NO, the penalty is (p − y)². Average that penalty over all 100 contracts. A zero forecast incurs a penalty of one on the lone YES and zero everywhere else. At 1%, the YES costs 0.9801 and each NO costs 0.0001. Together those terms give an average of 0.0099. The two forecasts can make exactly the same hard decisions at a 50% cutoff while getting different probability scores.
| Constant YES probability | Brier score | Skill vs 1% |
|---|---|---|
| 0% | 0.0100 | −0.0101 |
| 1% | 0.0099 | 0.0000 |
| 10% | 0.0180 | −0.8182 |
| 50% | 0.2500 | −24.2525 |
The 10% row exposes a trade-off that disappears if you report only the one miss. That forecast reduces the penalty on the YES to 0.81. It raises the penalty on each of 99 negatives to 0.01, so the total is 1.80 and the average is 0.0180. A constant 50% forecast incurs 0.25 in every case. Using that number as the only benchmark would make all three lower-probability forecasts look strong. The bar is too easy for this event mix.
Put the reference on the same scoreboard
Brier skill score is one minus the model score divided by the reference score. Use the same outcomes, the same weights and the same prediction cutoff for both scores. Against 0.0099, the always-NO forecast at 0.0100 gets approximately −0.0101 in skill-score units. The 10% forecast gets approximately −0.8182. Zero means parity with the chosen reference and one is the perfect score when the reference is positive. A negative value means the model had more squared error than that reference.
The difference of 0.0001 between the two lowest rows matters because the reference itself is small. A relative score can therefore look dramatic when a rare category supplies little room for improvement. I would keep the raw scores and the case count next to the skill score. A label such as “negative skill” without the reference name and denominator hides the part you need to check. If the reference has zero error on the evaluation set, the division is undefined. The raw pair of scores is still reportable.
Decide what the baseline could have known
Suppose the project covers weather-like questions, tournament winners and deadline contracts. Pooling all of them into one base rate may hide large differences in how the contracts were selected. Pick a reference that can be computed without access to future settlements. One defensible starting point is a historical rate from comparable categories, using only resolved cases available before each forecast date. Keep the grouping rule fixed and state how you handle a category with very few past cases. Compare it with a simple pooled reference if the grouped estimate is unstable.
The worksheet has one YES by construction. Estimating the reference from that same answer key and calling the comparison out-of-sample would make the test circular. To evaluate an actual model, save a dated training cutoff and a dated test window. Record one probability per contract at a fixed horizon, for example a snapshot a day before a published cutoff when that snapshot exists. Use the same snapshot rule for model and reference. Excluding a forecast because its price was inconvenient after settlement changes the case set and changes the score.
Keep the denominator visible
Score only contracts with a known binary outcome under the written evaluation rule. Document the handling of cancellations, voids and missing snapshots before running the calculation. A cancelled case needs an explicit rule because treating it as NO adds an outcome the question never resolved. If many questions depend on the same election, match or economic release, describe that dependence. A hundred contracts sharing the same underlying event contain less independent evidence than their row count suggests. Show results by event group where the sample supports it.
There is a separate issue when scores are compared between teams, periods or product areas. On a constructed set with 20 YES outcomes out of 100, a constant forecast of 20% scores 0.16. On our rare set the constant 1% forecast scores 0.0099. Neither constant ranks any cases within its own set. The lower score comes with a different base rate. To compare two models, score them on the same rows if possible. When sets must differ, report the event mix and the reference for each set and explain any change in coverage.
What to do when the rare outcome is absent
Keep a window with no YES outcomes in the results if it meets the original inclusion rule. On that window the constant zero forecast scores zero, while a constant 1% forecast scores 0.0001. Show the case count and note the missing positive class. The result says how the forecasts scored on that particular window. It leaves their performance on positive cases open. A second period with a known count of YES outcomes is much easier to interpret than a score averaged over several windows with undisclosed composition.
Turn an impressive number into a checkable record
The smallest useful record has a contract identifier, a forecast timestamp, a forecast probability, the reference probability and the outcome. Add the inclusion reason and the weight if either can differ across rows. Before rounding, reproduce the totals for YES and NO separately and make sure both methods saw the same set. A single rare YES can dominate a short period. Showing the numerator, denominator and event count lets the reader see that immediately.
In this example the 1% reference earns the lowest score among the four constants. A useful next test is whether a forecast can assign higher probabilities to some cases without increasing error on the whole evaluation set. That calls for predictions saved before settlement and for enough actual positive outcomes to judge the difference. A table of synthetic outcomes answers the arithmetic question. Evidence about forecasting performance starts with a record that another reader can score again.